At Kurtosys we pride ourselves on information security, protecting our customers digital estates and ensuring we capture the most detailed data possible on the type of traffic that hits their websites. This gives our customers’ risk assessment teams critical information that support their threat detection mechanisms. My responsibilities at Kurtosys include helping our customers have consistent access to this type of information through our ISOC (Information Security Operations Centre) service.
Gerhard Vana – Information Security Engineer
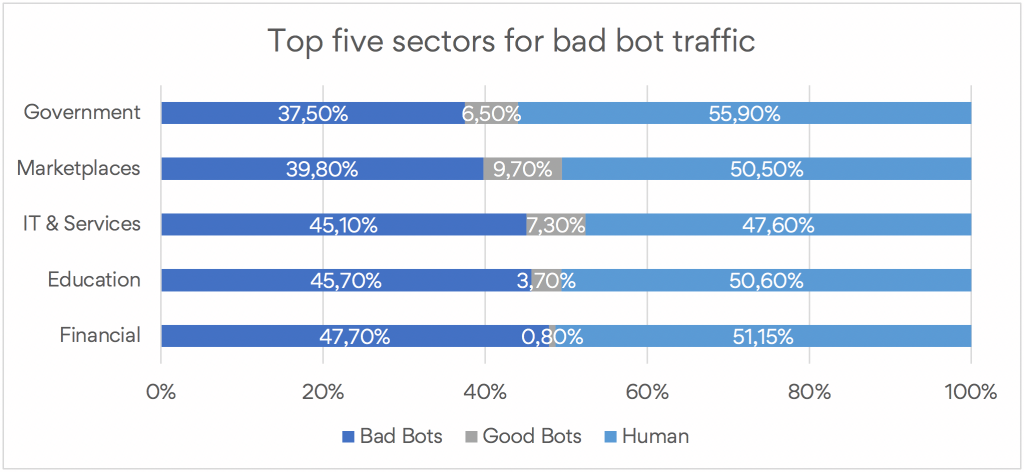
Financial services take the brunt of web robot traffic, with 47.8% of all registered traffic attributed to bots. This compares to nearly a quarter across all sectors, according to a 2020 study by Imperva. The next most affected sector is education services, where 45.7% of web traffic is attributed to bots.
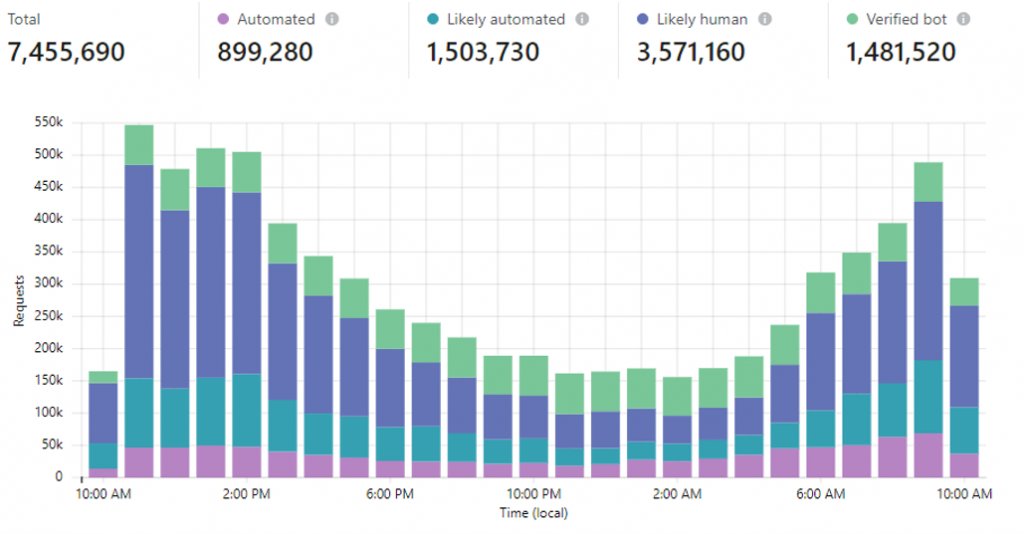
These figures might sound inflated to some, but they are consistent with the traffic on Kurtosys-hosted sites. In fact, on our sites, financial services bot traffic is even higher. The chart below shows that only 47% of traffic on our network’s perimeter (our edge) is human.
Bot traffic breakdown over 24-hour period
Source: Kurtosys
We expect this because our websites tend to have more automated processes than others. But, even discounting that, the percentage of bot traffic would still be 46%.
Identifying bot types
This matters because of the existence of bad bots, which can affect a site in many ways.
There are many different types of bad bots and defining them helps us assess the impact better:
- simple bad bots connect to sites using automated scripts from a limited range of internet protocols (IPs) and do not mask their user agent
- moderate bad bots use headless browsers to simulate browser activity, which includes executing JavaScript
- sophisticated bad bots attempt to simulate human traffic by producing mouse movements and site interactions. These are the hardest to detect
- advanced persistent bots (APBs) combine moderate and sophisticated techniques. These tend to use multiple IPs across geographical regions; change user agents; and use proxies while maintaining persistence on a target site.
Source: Imperva
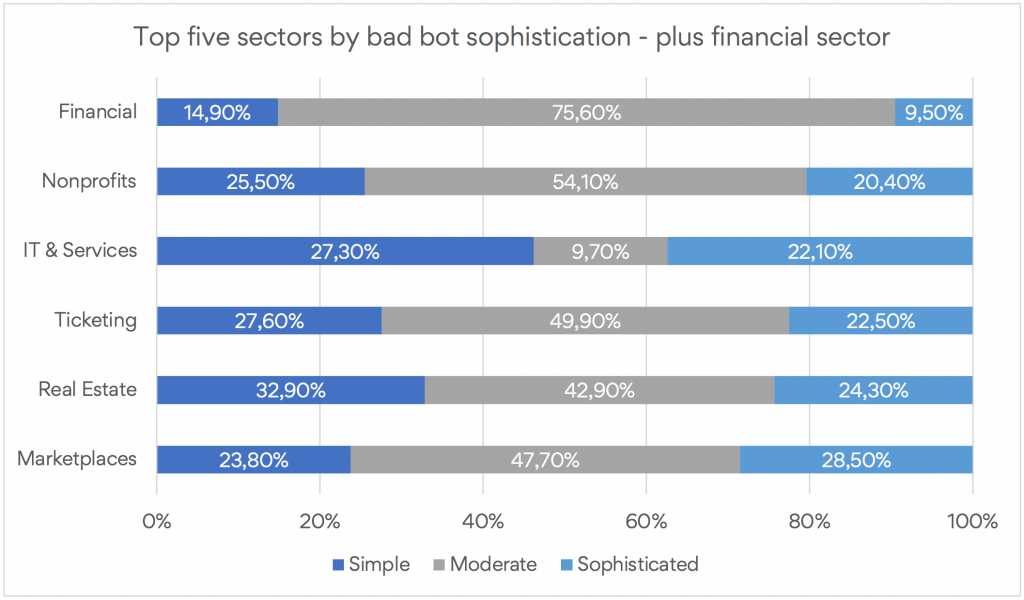
Though financial firms have the highest bot traffic, the sector fares dramatically better when we break it down by bot type. The financial sector is only 20th when ranked by percentage of sophisticated bots.
Source: Imperva
This number also correlates closely with the types of bots we see on Kurtosys’ edge. Most are content scraping, which means lifting text and publishing it elsewhere; vulnerability testing – not always for benign purposes; and account stuffing, which means making large numbers of login attempts with stolen credentials.
Where bots come from?
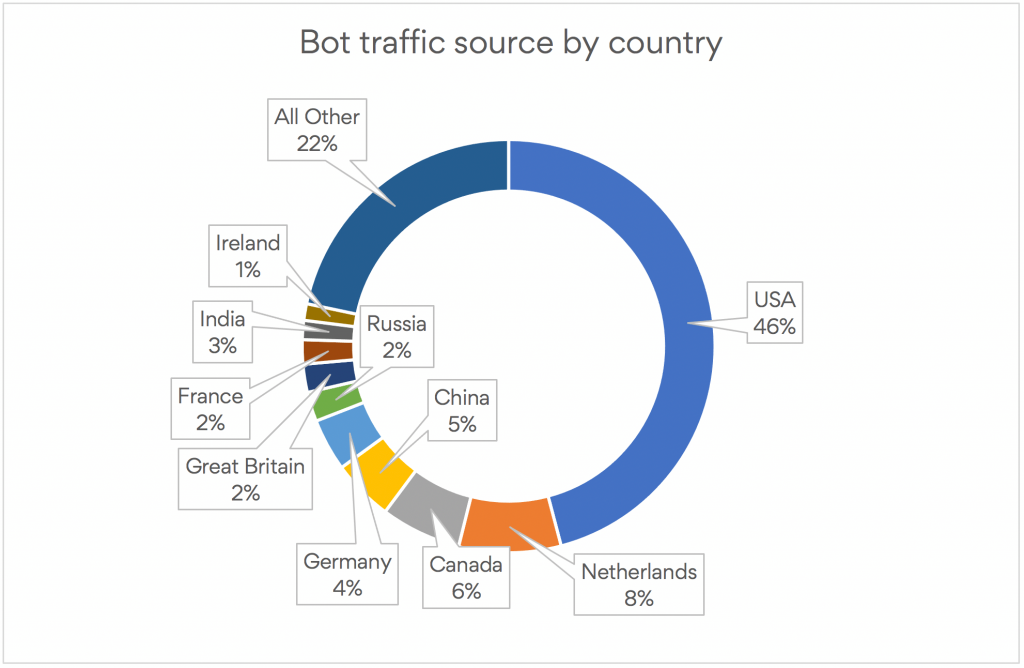
Perhaps the most surprising of Imperva’s statistics is that the US accounts for 45.9% of all bot traffic. This is because most emanate from data centers. This is far in front of second-place bot source, the Netherlands at 8%.
The top gainers for bot source statistics on the previous year are Netherlands, up from 5.7%, and Canada up from fifth to third place at 6%. China has also hit the top five for the first time at 4.8%.
Source: Imperva
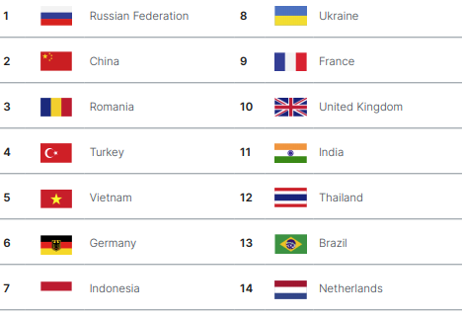
The table of countries with the most blocked bots may also surprise you.
Most blocked bots by country
Source: Imperva
The Russian Federation accounts for 21.1% of all blocked bots with China closely following at 19%. Romania is at 8.6%. This could be because they are highly reliant on the type of traffic that bots generate from these regions, or simply part of a good housekeeping strategy.
