Login

Leaders in ESG data visualization: Nordea

Introduction: overcoming ESG data pain

At Kurtosys, we put customer experience at the heart of tool development, including in environmental, social and governance (ESG) investment reporting. Good data visualization is essential for user experience. But ESG data is a pain point for many asset managers, so this series aims to help.

In each article, we examine the approach of one asset manager who excels in ESG reporting. In the first reviews, we examined BMO Global Asset Management and Federated Hermes, but today is the turn of Nordea Asset Management.  

Nordea Responsible Investments Report 2020

Overall experience

The first thing you notice about Nordea’s main website is the fresh, clean, no-nonsense layout. In our recent article 25 of the Best Asset Management Websites, we praised the site’s clear, accessible, modular architecture and simple naming structure. The main site was easy-to-use and functional, with a strong ESG theme throughout. The effort and consistency of approach applied to Nordea’s Responsible Investments report is equally impressive.

‘At a glance’ page steps up

The ‘at a glance’ section in last year’s Nordea RI report, was simply constructed to help show the scale of activity over 2019. We liked the arrow and non linear format. In 2020, the team have moved up a gear with an intuitive and easy to digest infographic. This illustrates the focus and significant resources that Nordea is putting into ESG.

Nordea ESG 2019 key stats
Nordea ESG 2020 key stats

Focused modules draw attention

These modules are focal points designed to draw readers’ attention to key areas of a page. In true Nordea fashion, the team get it right here with subtle colours and softer edges to add focus without being overbearing.

There is also a great balance of information in the space, with a variety of techniques allowing users to differentiate between the sections.

Nordea 2020 D&I Nordea 2020 carbon footprint

Clear sustainable goal section

Many ESG reports show how managers are aligning with the United Nations sustainable development goals (SDGs).

With typical simplicity, Nordea provides a very easy visual that highlights its SDG engagements.

Often, teams overcomplicate the way they communicate alignment to SDGs. But here, bar charts – colour coded to the SDG category with associated percentages – get the point across without users having to think hard or interpret information.

Nordea 2020 UN SDGs

Consistent charts aid familiarity

Throughout the report, Nordea’s charts are well thought out and relevant to the content they represent. With consistent colorways, everything feels familiar and easy to comprehend.

As you can see in this section from the 2020 voting schedule, they use a variety of well-proportioned charts that complement each other well.

The photos of the team also add a human element to the section and support the firm’s emphasis on transparency.

Leaders in ESG data visualization: Nordea 1

Extraordinary infographics

Infographics are notoriously difficult to do well. They should display complex information and data clearly, but can become over complicated and hard to read if executed poorly.

This often happens when internal teams who understand the information are reviewing the infographics.

Here, Nordea maps delivery on individual and collective engagements with investors exceptionally well. The subtle colours, tones and font weights bring this and other graphics throughout the report to life.

Iconography is another area that can easily be over complicated. Here, the icons are simple and applied without overuse or expecting the user to recognize them instantly – thus avoiding another common mistake.


Nordea 2020 ESG Engagements
Nordea 2020 Engaged Sectors

More clever infographics

There are clever infographics across other sections of the site too. These include the Nordea responsible investment framework model (below), is visualized in a simple, easy-to-understand way.

Below, Nordea lays out their climate-related targets in five core areas. The hierarchical structure brings to life the long, medium and short term goals and sub-targets.

Nordea 2020 RI framework
Nordea 2020 carbon emission goals

Smart spin on team pages

Another critical part of many reports is a ‘meet the team’ section. Nordea’s is a smart and sophisticated spin on a traditional organizational chart with the key members of the Nordea responsible investing team.

Consistent colors from previous call-out sections, and softened edges throughout, add a sophisticated feel.

Leaders in ESG data visualization: Nordea 2

Bold quotation spaces

Another important feature of many reports is key quotes from senior team members.

One element we loved about the Nordea site in our 25 of the Best Asset Management Websites article was the way they embrace white space. This adds a touch of class and clarity to the experience.

Their RI report is the same, using a very simple approach to quotations with a human element in the profile images.

The scale of the image is also bold. Rather than trying to cram in the image and quote, both receive a liberal amount of real estate, surrounded by white space to draw attention without being overbearing.

Leaders in ESG data visualization: Nordea 3

Summary

When we reviewed the Nordea Asset management website earlier this year, we noted how “bold color contrasts and consistent application of curved edges across the site add to the Nordic feel. It represents the brand exceptionally well.”

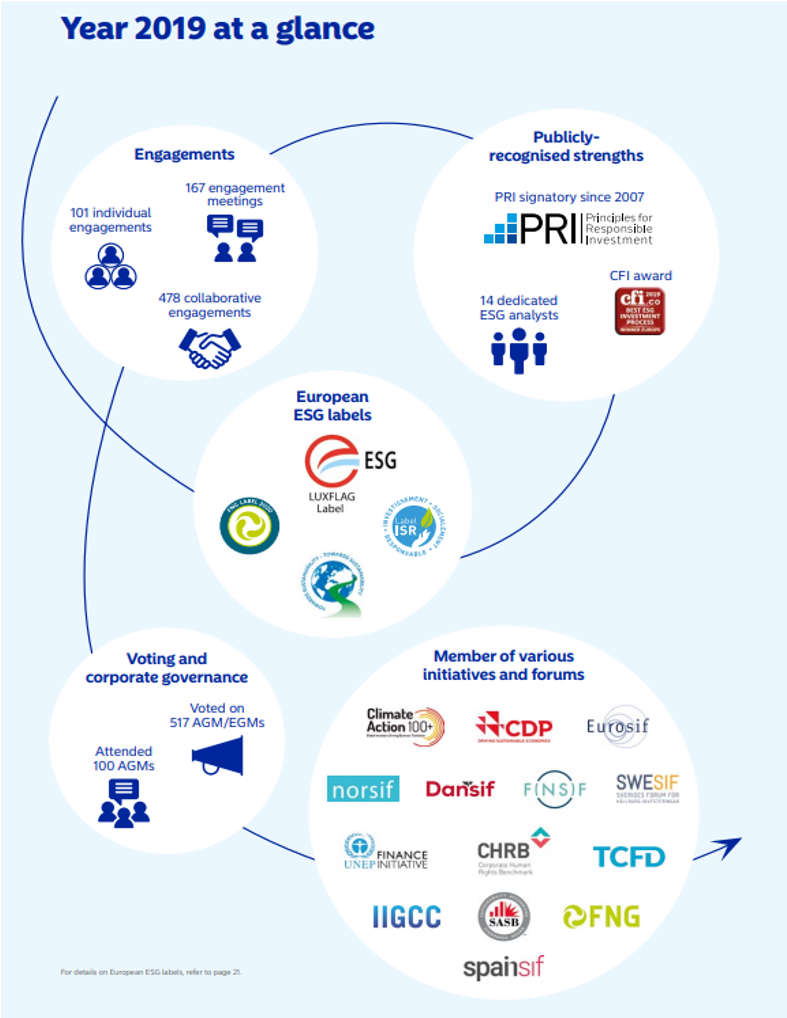
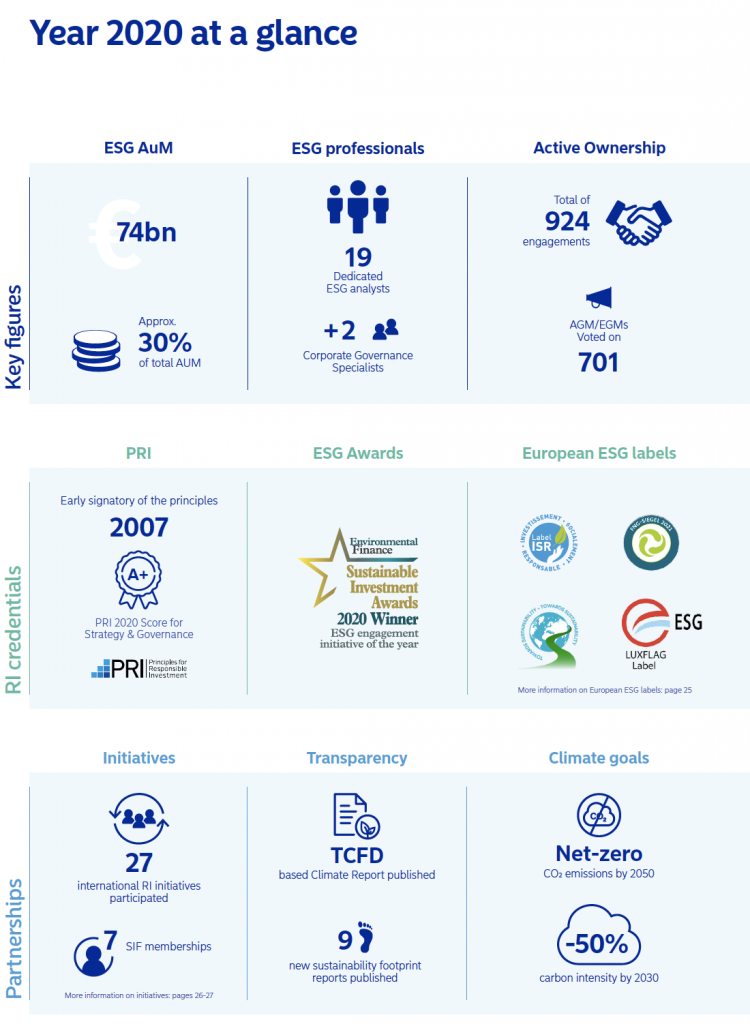
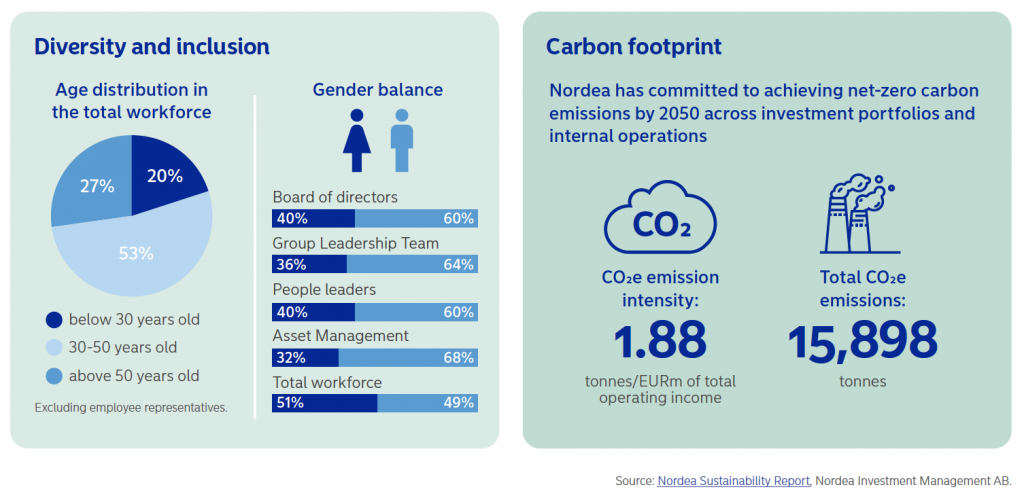
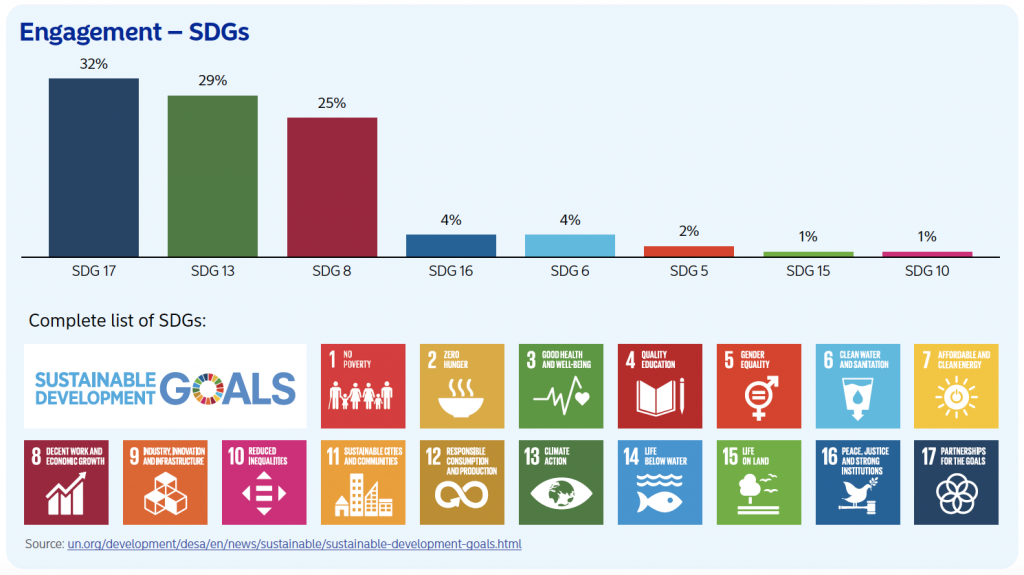
The firm nails its consistency here too, using the same principles to bring the ESG focus to life and highlight its importance to the manager.

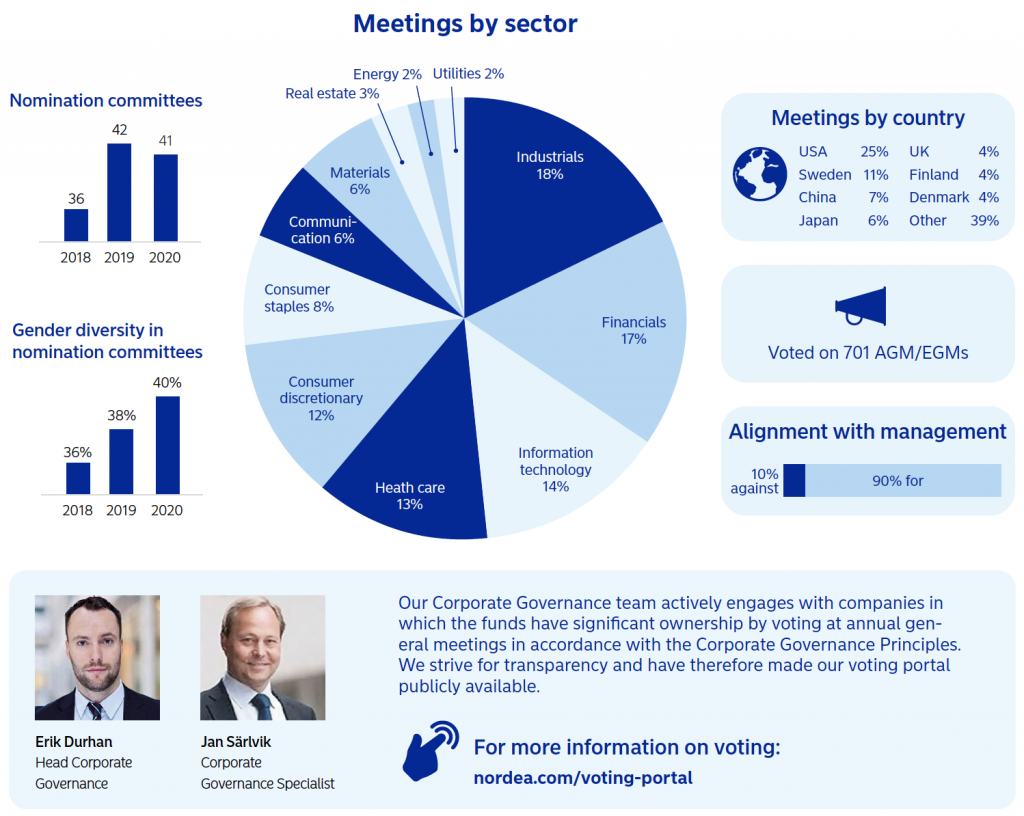
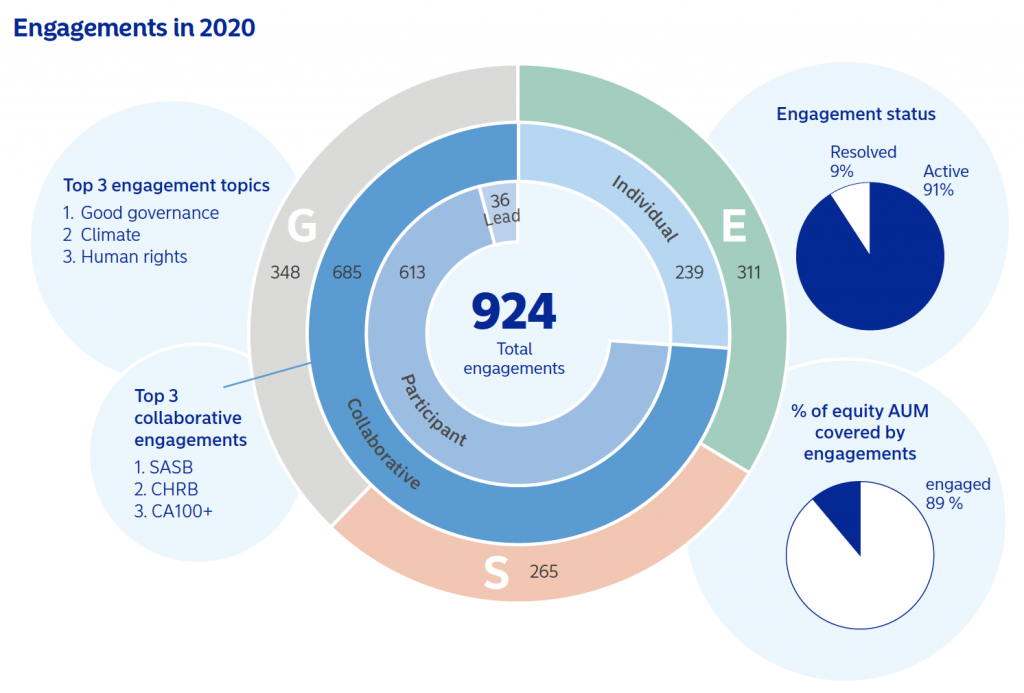
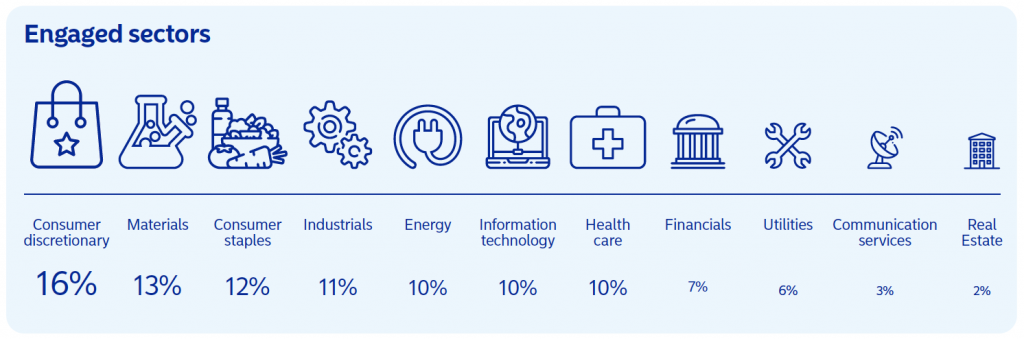
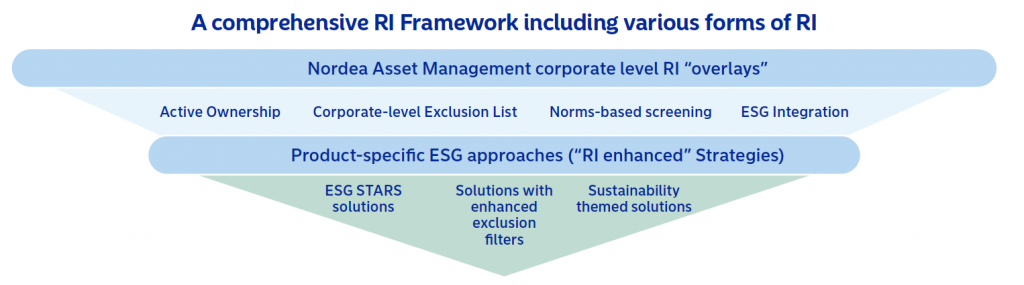
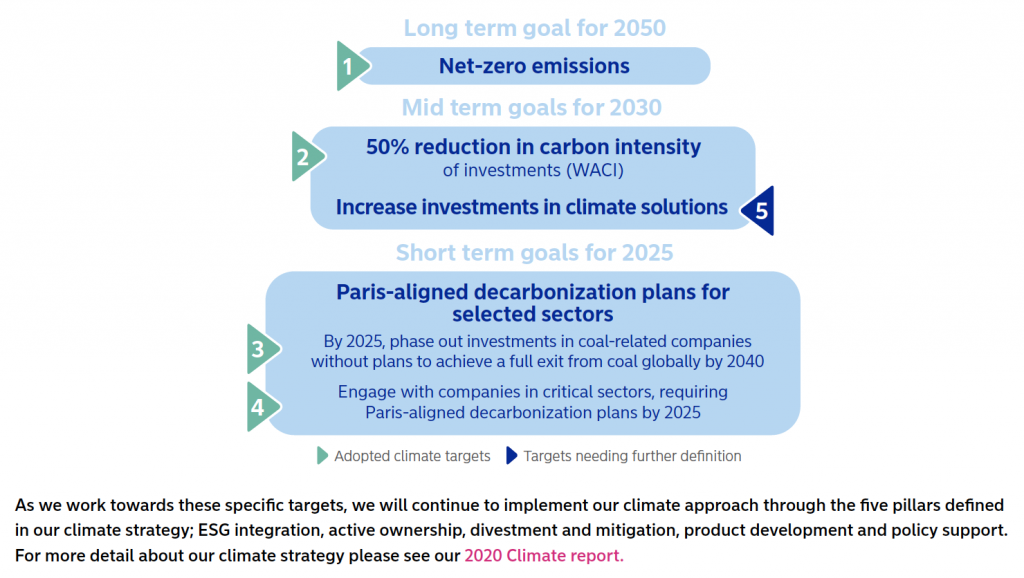
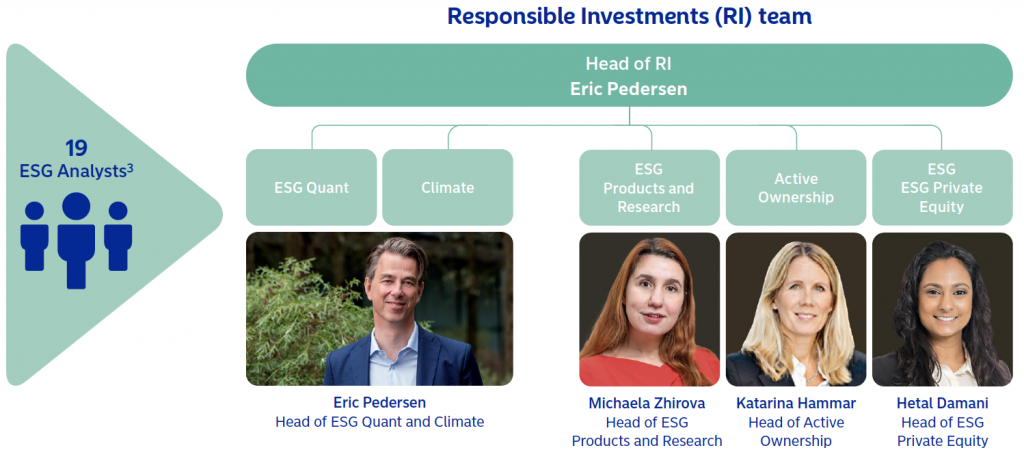
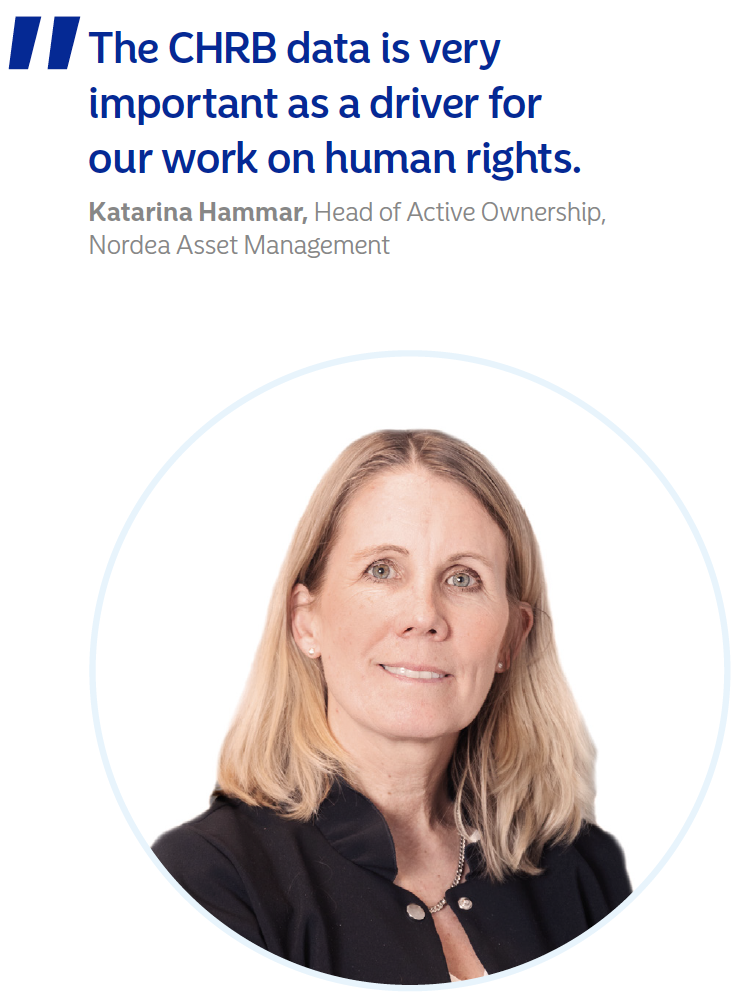
Nordea makes excellent use of sophisticated visuals, well considered charts, simple iconography, beautiful and relevant photography, color, and white space. This sets a great benchmark across the industry. When ESG is this important to your company, you put the effort in.

We continue to see fantastic examples of asset managers embracing creativity, modern design principles and best practice across their reporting. They deserve credit and we hope this series gives them some.

At Kurtosys, we are proud of our fast, scalable and easy to use technology. We love solving data visualization problems with creativity. Are you struggling to keep up with changing trends in data visualization for ESG reporting? Do you need to automate difficult and costly processes, deliver critical data at pace, or update your user interfaces and website design?

If so, get in touch today. Talk to our team and arrange a demonstration of how our tools can add value to your digital transformation.

Facebook
X
LinkedIn

Get in touch

Drop us a line and a member of our team will be in touch with you shortly.