Configure once. Reuse everywhere.
Meet Studio. Build reporting components that can be reused across all your reports and digital experiences, from PDFs to PowerPoints and from Sites to Portals and beyond.
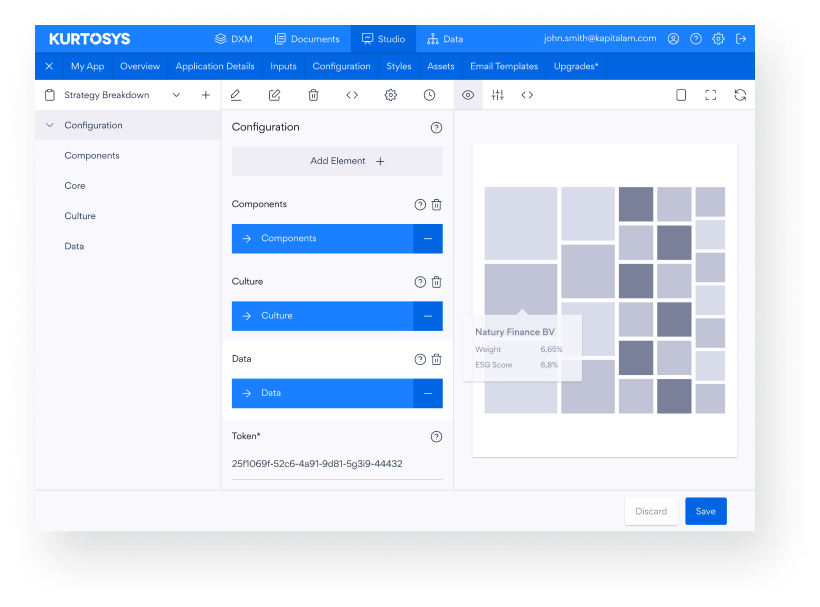
Wizard
Choose from a library of hundreds of pre-configured reporting components to build your library from.
Data
Integrate your own data seamlessly via Kurtosys Data or connect to your own REST APIs.
Configure
Customize your components to add your own business rules. Work visually or leverage our JSON based DSL.
Styling & theming
Leverage a consistent set of brand guidelines across your components. Change styles once and re-apply globally.
Live preview
Visualize component changes in real-time across multiple layouts and device types.
Publishing workflow
Publish changes, track audit history, and leverage multiple development versions to manage your publishing process.
Land and expand
Like you, your investor’s time is precious. Put everything at their fingertips with your portal dashboard, granting access to their mandates, thought leadership, and other key information.
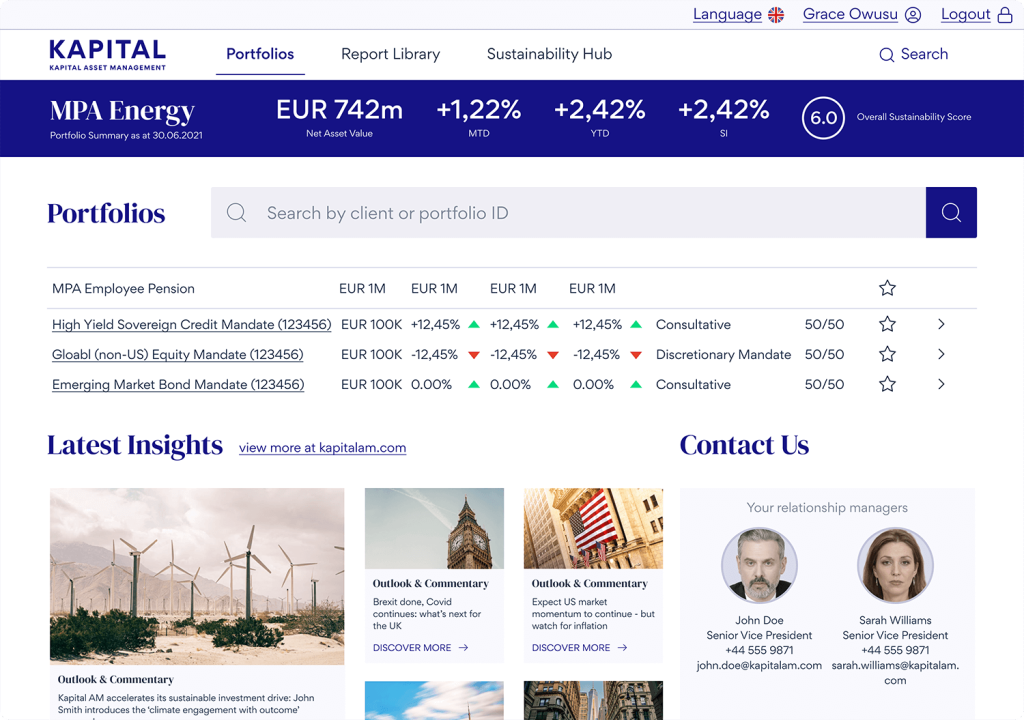
Navigation
The structure of your portal is completely customizable, and its navigation can reflect its precise structure
Client summary
Give investors an overall view of their mandates, including key data such as performance and ESG scores.
Portfolio explorer
Explore and drill down into specific investment mandates. Filter, favourite, and search.
Insights
Combine thought leadership, video, and audio together with investment information to maximize brand exposure.
Localize
Allow clients to view content and reporting in their primary language, complete with local formatting.
User profile
Allow clients to manage their profile, reset password, and control two factor authentication settings.
Global search
Put everything in your portal within reach: documents, portfolios, reports, and other content.
Key contacts
Ensure clients can easily find help or support when they need you.
Portfolio reporting
Drilling deeper into a portfolio can reveal a world of interactive reporting for your clients, including performance, risk, holdings, transactions, and sustainability related data.
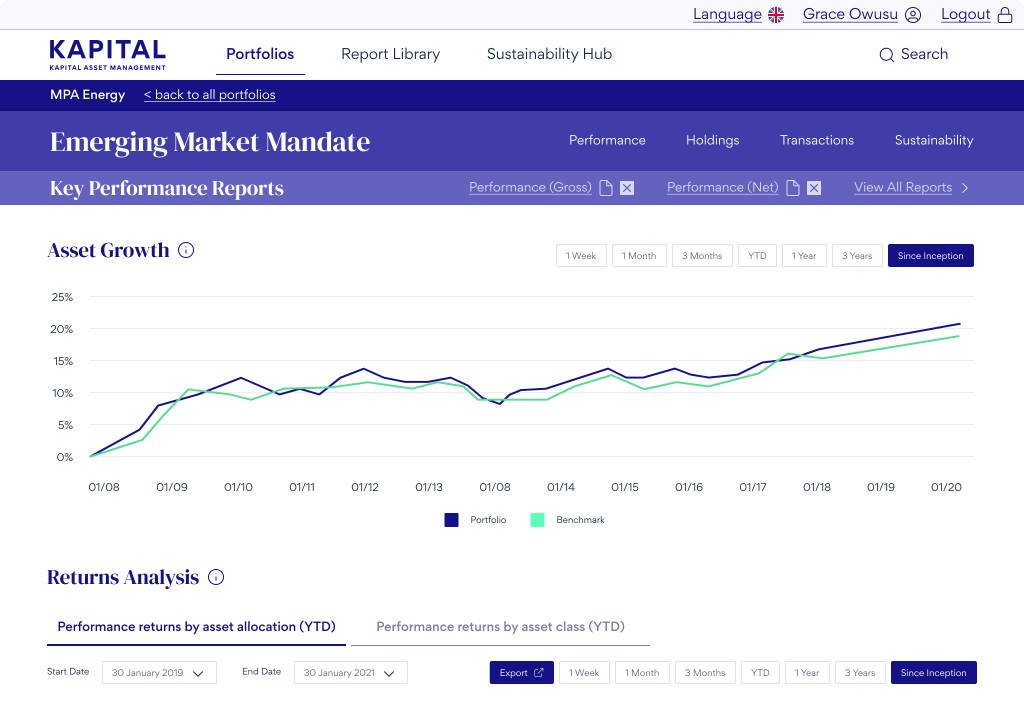
Key reports
Give quick access to dynamic print on-demand reports. Customize, download, and subscribe.
Visualizations
Bring client data to life with Kurtosys Studio interactive data visualizations.
Report sections
Structure interactive reports into different sections to assist in navigation
Tab groups
Combine thought leadership, video, and audio together with investment information to maximize brand exposure.
Report navigation
Create overarching report sections to collate like data.
Time selectors
Allow clients to explore historical data with configurable time selectors.
Data export
Export any and all data to structured data formats such as CSV.
Tabular reporting
Configure interactive tables, including aggregation, summation, and other advaned features.
Sustainability
Expose ESG data at portfolio and issuer level. Allow clients access to engagement information and other non-public datasets.
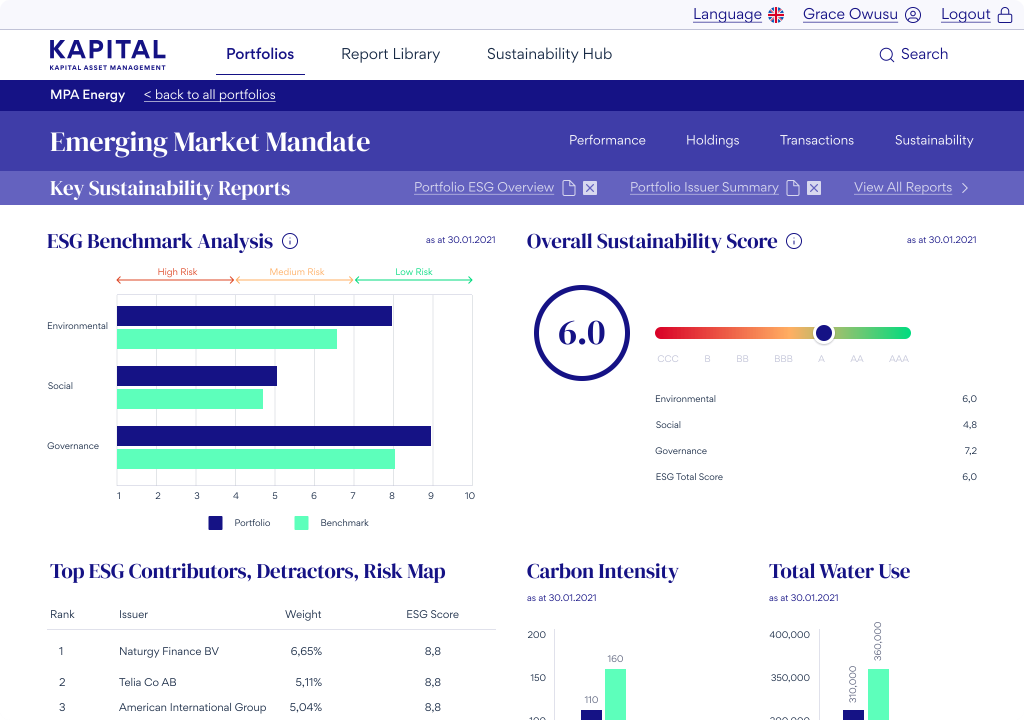
ESG benchmarking
Illustrate portfolio positioning vs chosen benchmarks in terms of key ESG factors.
Disclosures
Expose key disclosures in line with popovers or as footnotes. Manage everything centrally using Kurtosys Data
ESG metrics
Dive deeper and expose aggregate ESG metrics such as carbon intensity, water use, and more.
Issuer level analysis
Drill down into issuer level data, showcasing aggregate scores or deeper information in separate dashboards, including engagement and risk.
Sustainability scoring
Simplify understanding of ESG impact with use of overall scoring, either proprietary or vendor managed
Time selectors
Allow clients to explore historical data with configurable time selectors.
Data export
Export any and all data to structured data formats such as CSV.
Heat maps
Simplify complex relationships between position size and ESG risk with heatmaps.
Configure once. Reuse everywhere.
Meet Studio. Build reporting components that can be reused across all your reports and digital experiences, from PDFs to PowerPoints and from Sites to Portals and beyond.
Wizard
Choose from a library of hundreds of pre-configured reporting components to build your library from.
Data
Integrate your own data seamlessly via Kurtosys Data or connect to your own REST APIs.
Configure
Customize your components to add your own business rules. Work visually or leverage our JSON based DSL.
Styling & theming
Leverage a consistent set of brand guidelines across your components. Change styles once and re-apply globally.
Live preview
Visualize component changes in real-time across multiple layouts and device types.
Publishing workflow
Publish changes, track audit history, and leverage multiple development versions to manage your publishing process.
Land and expand
Like you, your investor’s time is precious. Put everything at their fingertips with your portal dashboard, granting access to their mandates, thought leadership, and other key information.
Navigation
The structure of your portal is completely customizable, and its navigation can reflect its precise structure
Client summary
Give investors an overall view of their mandates, including key data such as performance and ESG scores.
Portfolio explorer
Explore and drill down into specific investment mandates. Filter, favourite, and search.
Insights
Combine thought leadership, video, and audio together with investment information to maximize brand exposure.
Localize
Allow clients to view content and reporting in their primary language, complete with local formatting.
User profile
Allow clients to manage their profile, reset password, and control two factor authentication settings.
Global search
Put everything in your portal within reach: documents, portfolios, reports, and other content.
Key contacts
Ensure clients can easily find help or support when they need you.
Portfolio reporting
Drilling deeper into a portfolio can reveal a world of interactive reporting for your clients, including performance, risk, holdings, transactions, and sustainability related data.
Key reports
Give quick access to dynamic print on-demand reports. Customize, download, and subscribe.
Visualizations
Bring client data to life with Kurtosys Studio interactive data visualizations.
Report sections
Structure interactive reports into different sections to assist in navigation
Tab groups
Combine thought leadership, video, and audio together with investment information to maximize brand exposure.
Report navigation
Create overarching report sections to collate like data.
Time selectors
Allow clients to explore historical data with configurable time selectors.
Data export
Export any and all data to structured data formats such as CSV.
Tabular reporting
Configure interactive tables, including aggregation, summation, and other advaned features.